Augmented Reality (AR) and Virtual Reality (VR) in Manufacturing Market

Augmented Reality (AR) and Virtual Reality (VR) in Manufacturing Market By Component (Hardware, Software, Services) By Technology (Augmented Reality, Virtual Reality) By Device (Head-mounted Display, Head-up Display, Handheld Devices) By Application (Product Design & Development, Safety & Training, Maintenance & Repair) - Global Opportunity Analysis and Industry Forecast, 2023-2031

ICT & Media | March 2023 | Report ID: EMR0051 | Pages: 215

The global augmented reality (AR) and virtual reality (VR) in manufacturing market size was estimated at USD 8.5 billion in 2022 and is expected to hit around USD 73.1 billion by 2031, growing at a CAGR of 24.80% from 2023 to 2031.

Augmented Reality (AR) and Virtual Reality (VR) are technologies that provide a 360-degree immersive experience in a simulated environment and are powered by analytical insights. Manufacturers have increasingly adopted augmented reality and virtual reality (AR/VR) devices for simulative applications, and their use for plant improvement and workforce training has fueled industry growth. Recent advances in AR and VR image and sound capture technologies, as well as the availability of compatible electronic products such as tablets and headsets, have created significant market opportunities.

For example, Microsoft launched its HoloLens 2 mixed reality headset in India in January 2022, allowing users to interact with holograms more realistically. The application of industrial robots, which can detect errors and provide real-time virtual support, has also increased demand for AR and VR technologies in manufacturing. Adoption of AR and VR can also help organizations reduce R&D costs and re-allocate resources for improved outputs, particularly in the context of the Covid-19 pandemic.

The combination of VR, AR, and MR is expected to improve interactive experiences, and the supply of new AR, VR, and MR products is expected to grow the market. The adoption of these technologies in the context of the Fourth Industrial Revolution is driving this trend.


Augmented Reality (AR) and Virtual Reality (VR) in Manufacturing Market REPORT SCOPE & SEGMENTATION

Report Attribute

Details

Estimated Market Value (2022)

8.5 Bn

Projected Market Value (2031)

73.1 Bn

Base Year

2022

Forecast Years

2023 - 2031

Scope of the Report

Historical and Forecast Trends, Industry Drivers and Constraints, Historical and Forecast Market Analysis by Segment- By Component, By Technology, By Application & Region

Segments Covered

By Component, By Technology, By Application & Region

Forecast Units

Value (USD Billion), and Volume (Units)

Quantitative Units

Revenue in USD million/billion and CAGR from 2023 to 2031

Regions Covered

North America, Europe, Asia Pacific, Latin America, and Middle East & Africa, and Rest of World

Countries Covered

U.S., Canada, Mexico, U.K., Germany, France, Italy, Spain, China, India, Japan, South Korea, Brazil, Argentina, GCC Countries, and South Africa, among others

Report Coverage

Market growth drivers, restraints, opportunities, Porter’s five forces analysis, PEST analysis, value chain analysis, regulatory landscape, market attractiveness analysis by segments and region, company market share analysis, and COVID-19 impact analysis.

Delivery Format

Delivered as an attached PDF and Excel through email, according to the purchase option.


Segments Analysis:

Component Analysis

The hardware segment generated the most revenue in 2022, accounting for more than 56% of the market, and is expected to maintain its dominance throughout the forecast period. The increasing adoption of AR and VR devices across various industries is attributed to the growth of the hardware segment. Furthermore, technological advancements, networking, and connectivity improvements are expected to drive market demand for AR and VR headsets.

The services sector, on the other hand, is expected to grow at the fastest compound annual growth rate (CAGR) of 31.2% during the forecast period. This expansion is primarily due to an increase in immersive technology-related consulting and service offerings, such as maintenance, training, and security services, which are expected to grow further in the future.

The services segment is a new market, and several companies involved in augmented and virtual reality technology are investing in service firms. For example, in February 2022, ESI Group and CIMPA announced a collaboration to provide manufacturers with integrated VR solutions that integrate with existing product lifecycle management processes.

Technology Analysis

The augmented reality (AR) technology sector had the highest revenue share in 2022, accounting for more than 71.5%, owing to manufacturers' preference for AR technology, which allows them to access both manual and automated data at the same time. This expansion is also attributed to the use of augmented reality technology for production training, improving process efficiency, and improving employee well-being, resulting in an increase in the AR in manufacturing market. Furthermore, the use of augmented reality for maintenance in manufacturing plants is boosting industry growth.

From 2023 to 2031, the virtual reality technology sector is expected to have the highest CAGR of 32%. This expansion can be attributed to the widespread adoption of virtual reality, as well as the growing popularity of industrial IoT, industrial robots, and smart factories, which have created a primary platform for VR applications in the manufacturing industry. The ability of VR to provide a 360-degree content view experience in a highly immersive environment during modern production presents numerous market growth opportunities.

Device Analysis:

The head-mounted display (HMD) segment will account for more than 61% of total revenue in 2022, owing to rising demand for HMD devices and smart glasses for enterprise and industrial applications. Because of the use of HMDs for product improvement, this trend is expected to continue throughout the forecast period.

The handheld devices segment, on the other hand, is expected to grow at the fastest compound annual growth rate (CAGR) of 30.3% from 2023 to 2031. This expansion is being driven by an increase in demand for high-quality immersive technology. Handheld AR and VR devices allow users to experience technological advancements without having to wear devices on their heads or sit near a display terminal. The growing popularity and user base of handheld devices is expected to drive market demand even higher.

Application Analysis:

The product design and development segment accounted for over 52% of total revenue in 2022 and is expected to continue dominating the market during the forecast period. Manufacturers have increased market competition by incorporating AR and VR technologies into product creation and development. As a result, the ease of use of AR and VR technologies for product design and development drives market growth.

Over the forecast period, the safety and training segment is expected to grow at a lucrative CAGR of 29.1%. The demand for efficient enterprise maintenance and repair tools across companies drives the maintenance and repair sector. AR and VR in security and training are gaining traction as advanced technologies are being integrated into training programmes.

Regional Analysis:

North America had the largest revenue share of more than 37% in 2022 and is expected to grow during the forecast period. Because of the growing adoption of industrial revolution 4.0 in the manufacturing market, the United States contributed the most to this share.

Meanwhile, Asia Pacific is expected to be the fastest-growing region from 2023 to 2031, with a CAGR of 33.2%. In 2022, Japan and China held a significant share of the Asia Pacific market, and the region's continued rollout of 5G networks is expected to accelerate the adoption of AR and VR technologies in the manufacturing sector.

competitive Landscape

competitor analysis on the augmented reality (AR) and virtual reality (VR) in manufacturing market involves identifying and evaluating the strengths and weaknesses of other companies in the same industry. Here are some of the top competitors in the AR and VR in manufacturing market:

Key Market Players

  • Microsoft Corporation
  • Google LLC
  • Samsung Group
  • Vuzix Corporation
  • SkillReal
  • Ediiie
  • EON Realty, Inc.
  • Kaon Interactive Inc.
  • Worldviz, Inc.
  • SoluLab
  • ESI Group

Key Benefits of the Report

  • This study presents an analytical depiction of the Augmented Reality (AR) and Virtual Reality (VR) in Manufacturing industry along with current trends and future estimations to determine the imminent investment pockets.
  • The report presents information related to market key drivers, restraints, and opportunities, along with detailed analysis of the Augmented Reality (AR) and Virtual Reality (VR) in Manufacturing Market share.
  • The current market is quantitatively analyzed to highlight the Augmented Reality (AR) and Virtual Reality (VR) in Manufacturing Market's growth scenario.
  • Porter's five forces research demonstrates the market power of suppliers and buyers.
  • The report provides a detailed Augmented Reality (AR) and Virtual Reality (VR) in Manufacturing market analysis based on competitive intensity and how the competition will take shape in the coming years.


Augmented Reality (AR) and Virtual Reality (VR) in Manufacturing Market Report Segmentation

ATTRIBUTE

DETAILS

By Component

  • Hardware
  • Software
  • Services

By Technology

  • Augmented Reality
  • Virtual Reality

By Device

  • Head-mounted Display
  • Head-up Display
  • Handheld Devices

By Application

  • Product Design & Development
  • Safety & Training
  • Maintenance & Repair

By Geography

  • North America (USA and Canada)
  • Europe (UK, Germany, France, Italy, Spain, Russia and Rest of Europe)
  • Asia Pacific (Japan, China, India, Australia, Southeast Asia and Rest of Asia Pacific)
  • Latin America (Brazil, Mexico, and Rest of Latin America)
  • Middle East & Africa (South Africa, GCC, and Rest of Middle East & Africa)

Customization Scope

  • Available upon request

Pricing

  • Available upon request


The Report Answers Questions Such As:

  • What is the potential opportunity for the Augmented Reality (AR) and Virtual Reality (VR) in Manufacturing Market.
  • What are the major drivers, restraints, and opportunities of the Augmented Reality (AR) and Virtual Reality (VR) in Manufacturing Market.
  • What is the market share of the leading segments and sub-segments of the Augmented Reality (AR) and Virtual Reality (VR) in Manufacturing Market in the forecast period (2023-2031).
  • How is each segment of the Augmented Reality (AR) and Virtual Reality (VR) in Manufacturing Market expected to grow during the forecast period.
  • What is the expected revenue to be generated by each of the segments by the end of 2031.
  • What are the key development strategies implemented by the key players to stand out in this Augmented Reality (AR) and Virtual Reality (VR) in Manufacturing Market.
  • What is the preferred business model used for building Augmented Reality (AR) and Virtual Reality (VR) in Manufacturing Market.
  • Which area of application is expected to be the highest revenue generator in the Augmented Reality (AR) and Virtual Reality (VR) in Manufacturing Market during the forecast period.
  • Which end-user segment is expected to be the highest revenue generator in this industry during the forecast period.
  • What is the potential of Augmented Reality (AR) and Virtual Reality (VR) in Manufacturing Market in the emerging countries during the forecast period.

Request For Table of Content

Research Methodology

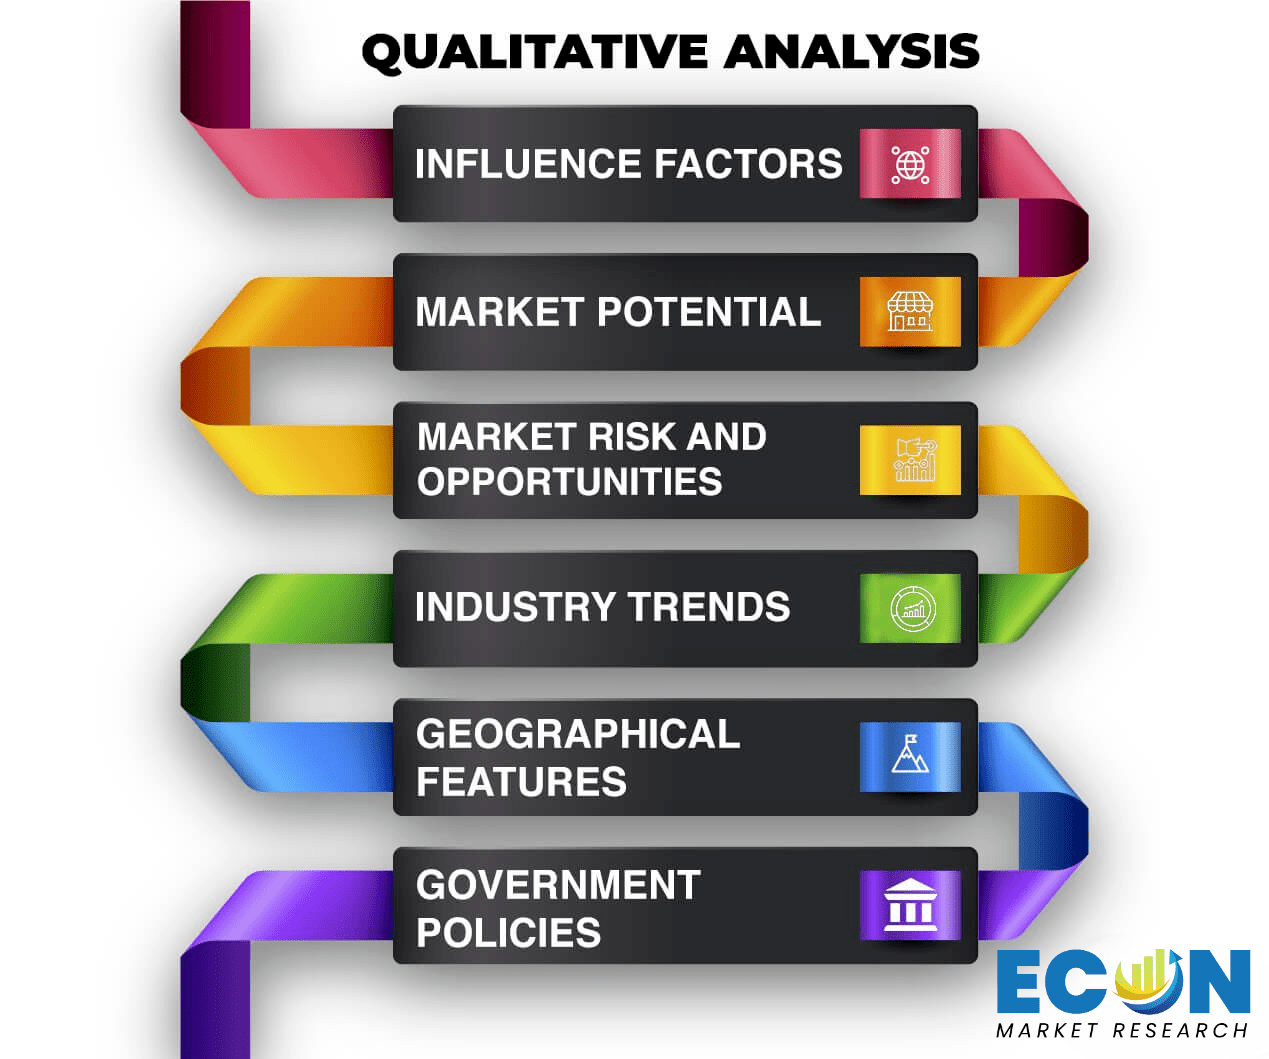
Our research methodology has always been the key differentiating reason which sets us apart in comparison from the competing organizations in the industry. Our organization believes in consistency along with quality and establishing a new level with every new report we generate; our methods are acclaimed and the data/information inside the report is coveted. Our research methodology involves a combination of primary and secondary research methods. Data procurement is one of the most extensive stages in our research process. Our organization helps in assisting the clients to find the opportunities by examining the market across the globe coupled with providing economic statistics for each and every region.  The reports generated and published are based on primary & secondary research. In secondary research, we gather data for global Market through white papers, case studies, blogs, reference customers, news, articles, press releases, white papers, and research studies. We also have our paid data applications which includes hoovers, Bloomberg business week, Avention, and others.
Data Collection

Data collection is the process of gathering, measuring, and analyzing accurate and relevant data from a variety of sources to analyze market and forecast trends. Raw market data is obtained on a broad front. Data is continuously extracted and filtered to ensure only validated and authenticated sources are considered. Data is mined from a varied host of sources including secondary and primary sources.

Primary Research

After the secondary research process, we initiate the primary research phase in which we interact with companies operating within the market space. We interact with related industries to understand the factors that can drive or hamper a market. Exhaustive primary interviews are conducted. Various sources from both the supply and demand sides are interviewed to obtain qualitative and quantitative information for a report which includes suppliers, product providers, domain experts, CEOs, vice presidents, marketing & sales directors, Type & innovation directors, and related key executives from various key companies to ensure a holistic and unbiased picture of the market. 

Secondary Research

A secondary research process is conducted to identify and collect information useful for the extensive, technical, market-oriented, and comprehensive study of the market. Secondary sources include published market studies, competitive information, white papers, analyst reports, government agencies, industry and trade associations, media sources, chambers of commerce, newsletters, trade publications, magazines, Bloomberg BusinessWeek, Factiva, D&B, annual reports, company house documents, investor presentations, articles, journals, blogs, and SEC filings of companies, newspapers, and so on. We have assigned weights to these parameters and quantified their market impacts using the weighted average analysis to derive the expected market growth rate.

Top-Down Approach & Bottom-Up Approach

In the top – down approach, the Global Batteries for Solar Energy Storage Market was further divided into various segments on the basis of the percentage share of each segment. This approach helped in arriving at the market size of each segment globally. The segments market size was further broken down in the regional market size of each segment and sub-segments. The sub-segments were further broken down to country level market. The market size arrived using this approach was then crosschecked with the market size arrived by using bottom-up approach.

In the bottom-up approach, we arrived at the country market size by identifying the revenues and market shares of the key market players. The country market sizes then were added up to arrive at regional market size of the decorated apparel, which eventually added up to arrive at global market size.

This is one of the most reliable methods as the information is directly obtained from the key players in the market and is based on the primary interviews from the key opinion leaders associated with the firms considered in the research. Furthermore, the data obtained from the company sources and the primary respondents was validated through secondary sources including government publications and Bloomberg.

Market Analysis & size Estimation

Post the data mining stage, we gather our findings and analyze them, filtering out relevant insights. These are evaluated across research teams and industry experts. All this data is collected and evaluated by our analysts. The key players in the industry or markets are identified through extensive primary and secondary research. All percentage share splits, and breakdowns have been determined using secondary sources and verified through primary sources. The market size, in terms of value and volume, is determined through primary and secondary research processes, and forecasting models including the time series model, econometric model, judgmental forecasting model, the Delphi method, among Flywheel Energy Storage. Gathered information for market analysis, competitive landscape, growth trends, product development, and pricing trends is fed into the model and analyzed simultaneously.

Quality Checking & Final Review

The analysis done by the research team is further reviewed to check for the accuracy of the data provided to ensure the clients’ requirements. This approach provides essential checks and balances which facilitate the production of quality data. This Type of revision was done in two phases for the authenticity of the data and negligible errors in the report. After quality checking, the report is reviewed to look after the presentation, Type and to recheck if all the requirements of the clients were addressed.

Frequently Asked Questions

×

Avail PDF Sample Reports